In maritime transportation, one of the most fundamental concepts is navigation. At its core, good navigation means getting a vessel from its departure point to its destination as safely and efficiently as possible.
In conventional voyage planning, this usually means finding the most efficient route between the port of departure and the destination while maintaining an acceptable level of safety. For shipowners, charterers and operators, every additional nautical mile can translate into higher fuel consumption, longer voyage duration, additional crew costs and increased exposure to operational risks.
This becomes even more important on long-distance trades connecting Asia with Europe and North America. When a vessel spends several weeks at sea, even a small change in voyage duration or routing can have a significant financial impact.
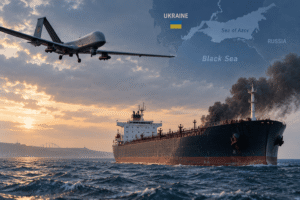
For decades, the Suez Canal has been one of the most important shortcuts connecting Asia and Europe. However, geopolitical instability, attacks on commercial shipping, the Houthi threat in the Red Sea and wider tensions across the Middle East have fundamentally changed the economics of this route.
As a result, some shipping companies have chosen to avoid the Red Sea and instead sail around the southern tip of Africa via the Cape of Good Hope.
The decision seems obvious.
The Cape route is much longer.
The vessel consumes more fuel.
The voyage takes more days.
So why would any shipowner voluntarily choose it?
The answer is much more complicated.
Suez Canal vs Cape of Good Hope: The Basic Question
Imagine a tanker sailing from Hong Kong to Rotterdam.
Should the vessel:
- Sail through the Suez Canal and Red Sea, or
- Avoid the Red Sea and sail around the Cape of Good Hope?
The answer cannot be determined by distance alone.
A professional voyage comparison needs to consider:
- Sailing distance
- Voyage duration
- Fuel consumption
- Bunker prices
- Suez Canal transit fees
- Charter hire
- Crew costs
- Additional operational expenses
- Insurance
- War-risk exposure
- Security risks
- Waiting time
- Cargo delivery requirements
This is where the economics of maritime transportation become particularly interesting.
Our Example: A 32,000 DWT Oil/Chemical Tanker
For this comparison, let’s use 32,000 DWT oil/chemical tanker with the following characteristics:
| Vessel Parameter | Assumption |
| Length overall | 180 m |
| Beam | 28 m |
| Deadweight | 32,000 DWT |
| Average speed | 12.5 knots |
| Fuel consumption | 22 MT/day |
| Fuel type | VLSFO |
| Departure | Hong Kong |
| Destination | Rotterdam |
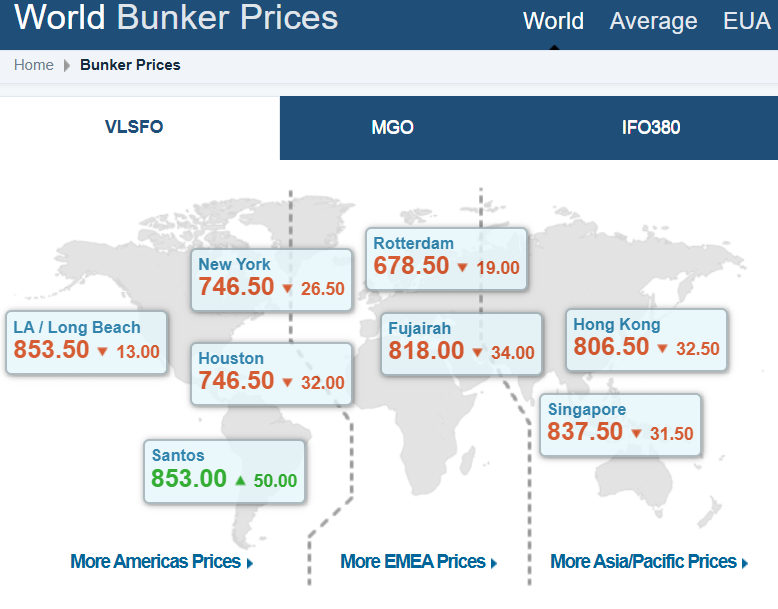
| VLSFO price assumption | $806/MT |
The vessel has two realistic routing options.
Route 1 — Via Suez Canal
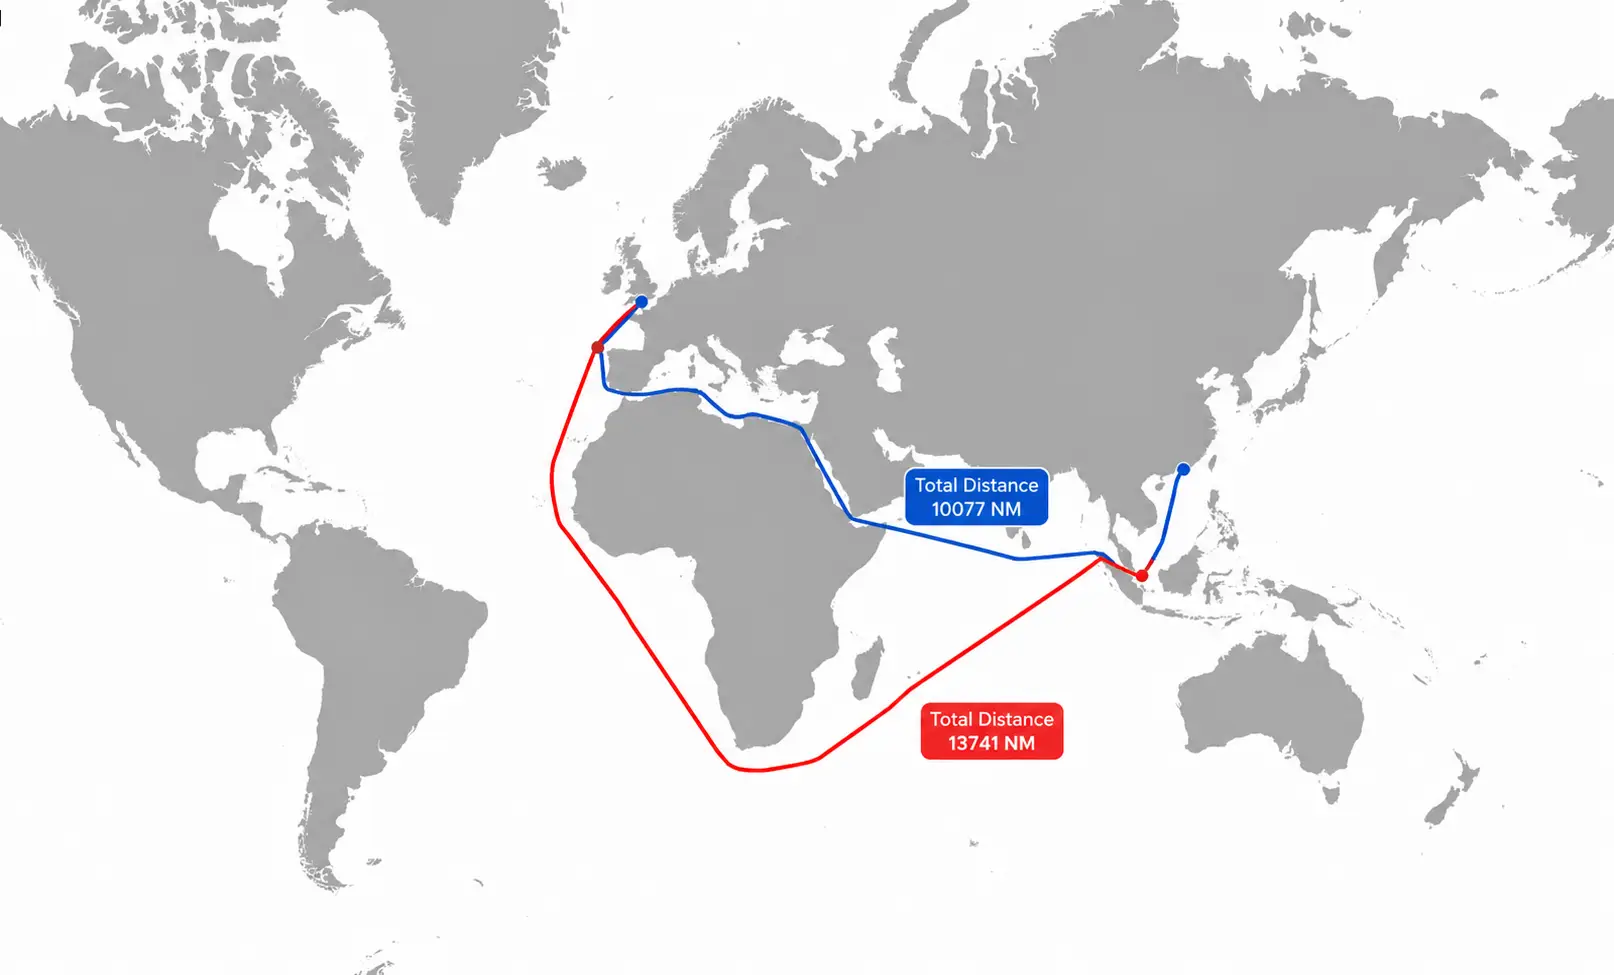
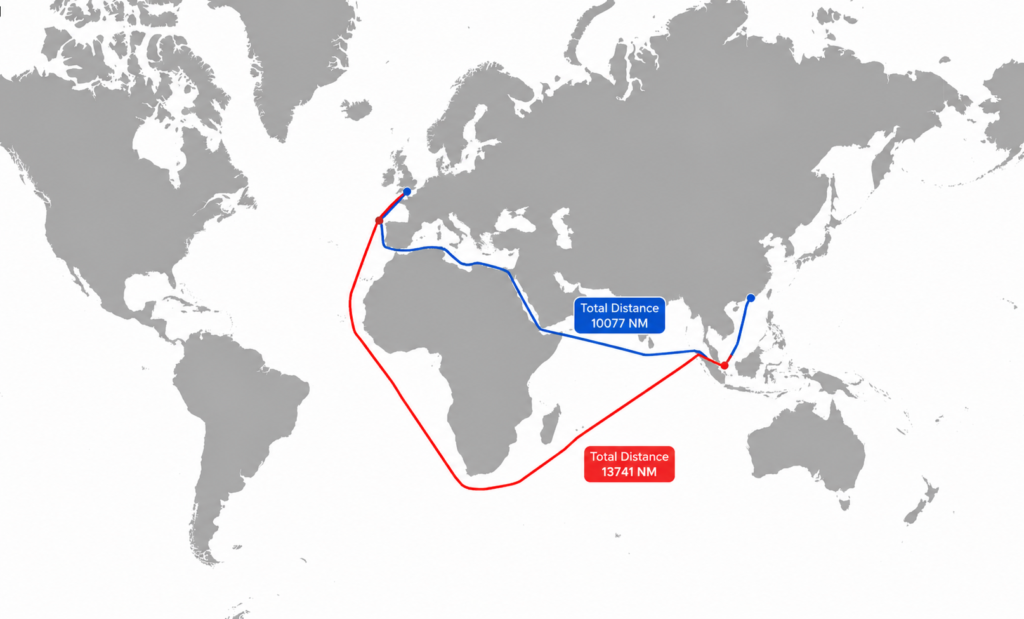
Hong Kong → Indian Ocean → Red Sea → Suez Canal → Mediterranean → Rotterdam
Approximate distance:
10,077 nautical miles (18,662 km)
Route 2 — Via Cape of Good Hope
Hong Kong → Indian Ocean → Cape of Good Hope → Atlantic Ocean → Rotterdam
Approximate distance:
13,741 nautical miles (25,448 km)
That means the Cape route adds approximately:
3,664 nautical miles
or about 36% more distance than the Suez route in this scenario.
Voyage Duration: Suez Has a Major Advantage
At an average speed of 12.5 knots, our vessel would require approximately:
Suez route
33 days 14 hours
Cape of Good Hope route
45 days 18 hours
That creates a difference of approximately:
12 days 4 hours
In other words, using the Suez Canal could theoretically get the cargo to Rotterdam almost 12 days earlier.
That is a huge advantage.
But time is not the only variable.
Fuel Consumption: How Much Does the Cape Route Cost?
Our tanker consumes approximately 22 metric tonnes of VLSFO per day.
Using the voyage durations above:
Suez route
33.58 days × 22 MT/day
≈ 739 MT of fuel
Cape route
45.75 days × 22 MT/day
≈ 1,007 MT of fuel
Using the assumed bunker price of $806 per metric tonne:
| Cost Item | Suez | Cape of Good Hope |
| Voyage duration | 33.6 days | 45.8 days |
| Fuel consumption | ~739 MT | ~1,007 MT |
| Fuel price | $806/MT | $806/MT |
| Fuel cost | ~$595,000 | ~$812,000 |
So the Cape route consumes approximately:
268 additional tonnes of fuel
or roughly:
$217,000 more in bunker costs
That sounds like a strong argument for Suez.
But we haven’t included the biggest variable yet.
The Suez Canal itself.
Note: the $806/MT figure is retained as the article’s scenario assumption. Actual bunker prices vary significantly by port and date; recent Hong Kong VLSFO assessments have been around the $800+/MT range.
The Hidden Cost of the Suez Canal: Transit Fees
The Suez Canal is not a free shortcut.
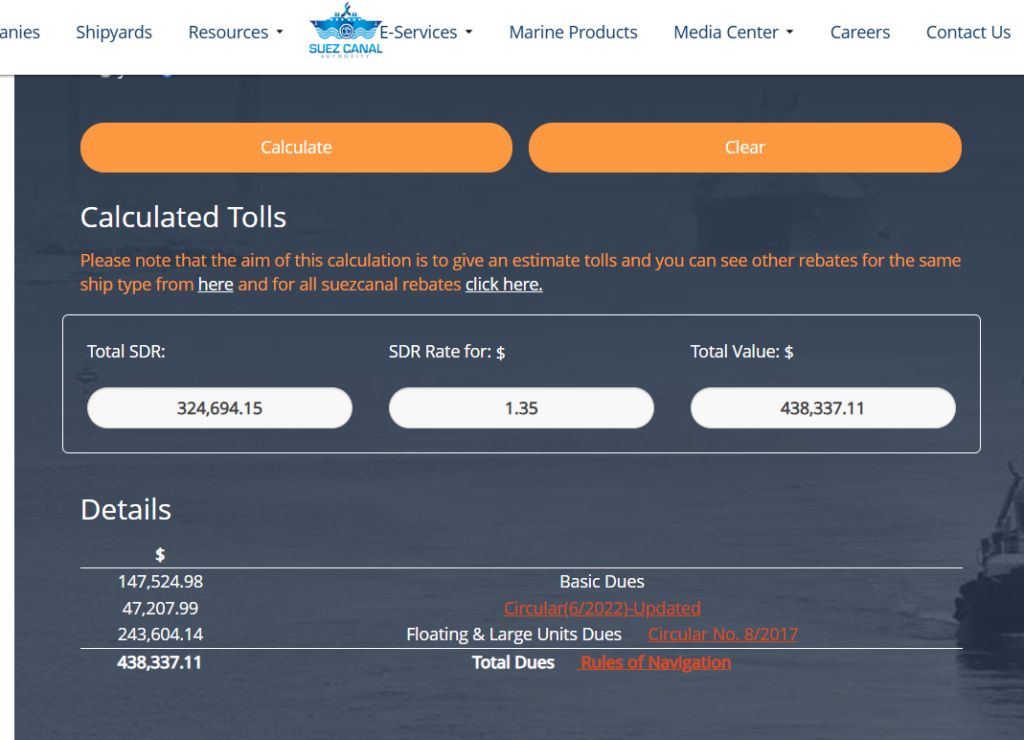
The Suez Canal Authority (SCA) charges vessels for transit, with normal dues calculated primarily according to the vessel’s Suez Canal Net Tonnage (SCNT) and vessel type. The SCA also maintains an official toll calculator and updates its toll structure periodically.
For our hypothetical tanker, we can use an estimated Suez transit charge of approximately:
$438,000
This changes the calculation totally.
Before the canal fee, the Suez route appeared cheaper by approximately $217,000 in fuel.
After adding the canal transit fee:
$595,000 + $438,000 = ~$1.033 million
Suddenly, the financial advantage is much smaller.
And we still haven’t considered the cost of the additional 12 days required by the Cape route.
The Cost of Spending 12 Extra Days at Sea
A vessel does not operate for free.
Every additional day at sea generates costs.
For our scenario, let’s assume:
- Additional crew-related costs: ~$30,000
- Additional operating expenses: ~$50,000
- Additional charter hire: ~$300,000
That gives the Cape route approximately:
$380,000 in additional non-fuel voyage costs
Add this to the Cape route’s bunker bill:
$812,000 + $380,000 = ~$1.192 million
At this point, it appears that Suez is still cheaper.
But this is where the modern Red Sea shipping environment changes the equation.
The Biggest Variable: Security and War-Risk Insurance
The problem with the Suez route is not simply the canal.
A vessel sailing from Asia to Rotterdam through Suez must also enter the Red Sea and pass through the Bab el-Mandeb region.
That creates an entirely different category of risk.
In normal circumstances, insurance is simply another operating cost.
In a high-risk war zone, however, the cost of insurance can change dramatically.
Recent market conditions demonstrate how quickly this can happen. In July 2026, Reuters reported that war-risk premiums for vessels operating in the southern Red Sea had increased sharply following attacks on commercial tankers, with some quoted rates reaching several percent of vessel value depending on the voyage and risk exposure.
The wider Middle East situation has also pushed marine war-risk costs substantially higher, with S&P Global reporting in July 2026 that additional war-risk premiums for some voyages through the Strait of Hormuz had reached 7.5–10% of hull value.
This is why simply comparing fuel consumption is no longer enough.
Why Insurance Can Change the Entire Calculation
Let’s use a simplified scenario.
Suppose the additional security and insurance exposure associated with the Suez/Red Sea route adds approximately:
$500,000
to our voyage economics.
This is not intended as a universal insurance quote. Actual war-risk premiums depend on vessel value, flag, ownership, charterer, cargo, route, security conditions, insurer and the precise area entered.
But for our scenario, adding $500,000 makes the comparison much more interesting.
Suez Route
| Cost | Approximate Amount |
| Fuel | $595,000 |
| Suez Canal transit | $438,000 |
| Additional security/insurance exposure | $500,000 |
| Total | ~$1.533 million |
Cape Route
| Cost | Approximate Amount |
| Fuel | $812,000 |
| Additional crew costs | $30,000 |
| Additional operating costs | $50,000 |
| Additional charter hire | $300,000 |
| Total | ~$1.192 million |
If we then assume approximately one day of waiting time associated with Suez and deduct around $25,000 from the Cape route’s incremental time-related cost, the Cape option remains around:
~$1.17 million
That produces a difference of roughly:
$360,000 in favour of the Cape of Good Hope route.
So, Should Every Ship Avoid Suez?
Not necessarily.
And this is the most important lesson from this comparison.
A route cannot be judged solely by:
“Which route is shorter?”
The real question is:
Which route provides the best combination of cost, time, safety and reliability for this particular cargo and vessel?
For a tanker carrying relatively time-insensitive cargo, accepting an additional 10–14 days at sea may be economically rational if it substantially reduces exposure to war risk and unpredictable insurance costs.
For a container ship carrying high-value or time-sensitive cargo, the calculation can be very different.
Why Do Container Ships Still Care About Transit Time?
Imagine a container ship carrying:
- Smartphones
- Computers
- Tablets
- Cars
- Machinery
- Spare parts
- Clothing
- Consumer electronics
- Industrial components
- Perishable goods
The cargo inside a container ship can represent an enormous amount of economic value.
For many of these products, time has a financial value.
A retailer waiting for a shipment does not necessarily care that a vessel saved $200,000 in bunker costs.
They care about receiving their inventory on time.
A manufacturer may be waiting for a critical component.
A supermarket may need perishable products.
An automotive plant may need spare parts.
This creates a completely different economic equation.
The Cost of a Longer Route Eventually Reaches the Consumer
This is where maritime transportation becomes directly connected to everyday life.
When a shipping company chooses the Cape of Good Hope instead of Suez, it may have to pay for:
- More fuel
- More crew time
- More vessel operating days
- More charter hire
- Additional maintenance exposure
- Additional port and scheduling complexity
- Higher inventory costs
- Longer cargo transit times
Those costs do not simply disappear.
They are distributed throughout the supply chain.
A shipping company may increase freight rates.
A freight forwarder may adjust its charges.
An importer may increase its landed cost.
A distributor may adjust its pricing.
And eventually, part of that additional transportation cost can reach the final consumer.
This is one of the reasons why disruptions to major maritime chokepoints can have economic consequences far beyond the shipping industry itself.
Research on maritime chokepoint disruptions has shown that rerouting can create wider network effects because longer voyages delay vessels and reduce effective shipping capacity elsewhere in the network.
So when consumers notice that imported goods are becoming more expensive, the explanation may sometimes be much further away than the local shop.
It may begin thousands of nautical miles away.
Suez Canal vs Cape of Good Hope: The Real Winner
Our 32,000 DWT tanker produces an interesting result.
| Factor | Suez Canal | Cape of Good Hope |
| Distance | 10,077 nm | 13,741 nm |
| Voyage time | 33.6 days | 45.8 days |
| Fuel consumption | ~739 MT | ~1,007 MT |
| Fuel cost | ~$595k | ~$812k |
| Canal fee | ~$438k | $0 |
| Additional time-related costs | Lower | Higher |
| Security exposure | Higher | Lower |
| War-risk exposure | Higher | Lower |
| Estimated total in our scenario | ~$1.53M | ~$1.17M |
| Best advantage | Speed | Predictability & security |
So, despite being almost 3,700 nautical miles longer, the Cape of Good Hope route can become economically attractive when the cost of security, insurance and geopolitical risk is included.
That is the real lesson.
The shortest route is not always the cheapest route.
And in modern shipping, the safest route can sometimes be the most economical route—even when it takes nearly two weeks longer.
A note on the calculations
The figures in this article are illustrative voyage-planning assumptions, not a commercial quotation. Actual results will vary according to vessel particulars, SCNT, draft, cargo, weather, speed, fuel consumption, bunker prices, canal tariffs, charter terms, insurance conditions, waiting time and geopolitical risk.
The Suez Canal Authority itself states that canal dues are calculated using the vessel’s SCNT and that its toll calculator provides an estimate; therefore, an actual vessel’s official Suez invoice may differ from the simplified figure used in this example.